Claims data is genuinely difficult to work with, and digestive conditions are one of the harder categories to analyze accurately. This guide can help.
Claims data is genuinely difficult to work with, and digestive conditions are one of the harder categories to analyze accurately. Spend attributed to a GI condition has a complex network of hiding places, so the prevalence and cost of GI conditions in an insured population is easy to understate even in a well-run claims and actuarial review.
Here are five practices that produce a more complete and more accurate picture:
1. Account for coding variances that occur in clinical care
GI symptoms are often ambiguous, and clinical interpretation and coding decisions can vary considerably. A clinician’s coding decision in the moment is reasonable, but the downstream effect on a claims analysis is significant.
For example, a typical IBS patient who presents in the ER with no acute finding, such as appendicitis, is far more likely to be coded as acute abdominal pain than as IBS. IBS shows up in claims data at roughly 5%, well below their known prevalence, while the signs and symptoms associated with those same conditions show up at roughly 15%. A claims review that only searches for the named diagnosis will miss most of the population actually affected by it.
2. Take a broad, comprehensive approach to GI-related ICD-10 codes
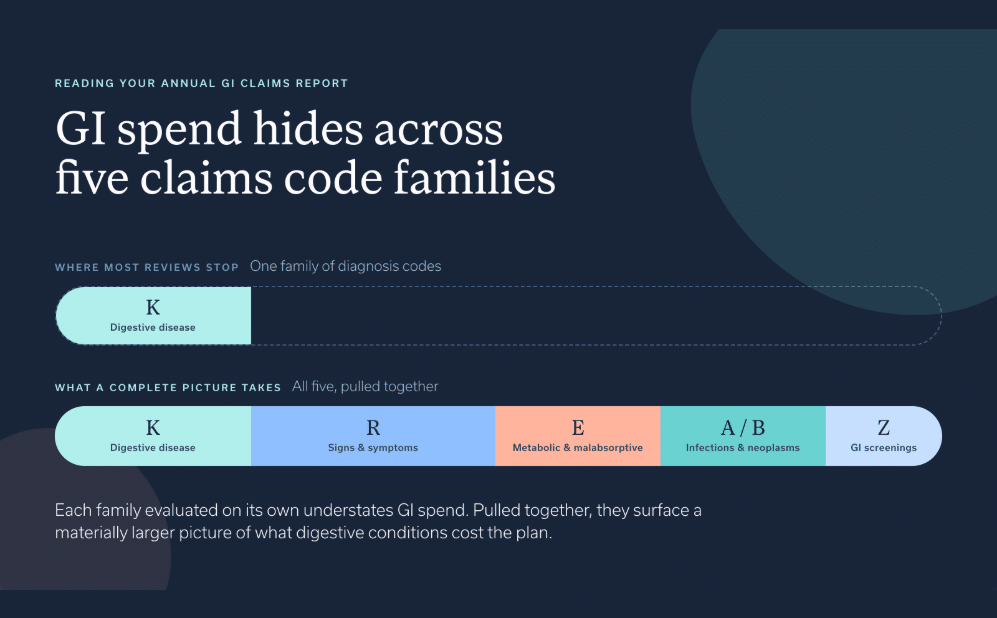
Most claims reviews start with a narrow set of GI diagnosis codes and stop there. A comprehensive approach pulls from five separate code families, each capturing a different piece of the GI picture.
- K codes cover diseases of the digestive system, including IBS and IBD.
- R codes cover symptoms and signs, including abdominal pain and changes in bowel habits.
- E codes cover endocrine, nutritional, and metabolic conditions, including lactose intolerance and other malabsorptive conditions.
- A and B codes cover infections and neoplasms, including gastroenteritis, H. pylori, and hepatitis.
- Z codes cover health status, including colorectal cancer and other GI-related screenings.
Each code family evaluated on its own understates GI spend. Pulled together, they surface a materially larger and more accurate picture of what digestive conditions are actually costing the plan.
3. Capture and categorize costs across medical and pharmacy channels
A complete GI cost picture spans more than the obvious diagnosis codes.
On the medical side, identify the procedures and diagnostics that drive the bulk of GI spend, including endoscopy, GI-specific lab testing, imaging, and GI surgery, along with the related care stakeholders and site-of-service costs that come with them, such as anesthesiology and facility fees. Be sure to query for both professional and facility claims.
On the pharmacy side, group together the specific medications that make up most of the spending on stomach and digestive drugs, including biologic drugs and other expensive brand-name treatments for GI conditions.
Medical and pharmacy spend on GI conditions are frequently analyzed separately. Bringing them together often reveals GI as a larger cost category than either view shows on its own.
4. Isolate the GI care journey
GI represents a large, heterogeneous population with high variance in spend driven primarily by symptom acuity. Most of the utilization and cost concentrates around the moments when a patient’s symptoms escalate to a severe enough level that they seek care. Because of this, GI spend is better understood by analyzing episodes of care than by looking at a flat annual total. That means defining and analyzing the spend that occurs in the roughly 12 months surrounding an escalation event, whether that’s a first gastroenterologist visit, an ER visit for a GI issue, or a visit to another provider type prompted by a GI issue. An episode-based view surfaces the true cost trajectory of an unresolved GI condition in a way that an annual aggregate cannot
5. Acknowledge those suffering in silence
No matter how rigorous the claims methodology, assume that a meaningful share of the population is suffering in silence: managing symptoms on their own, seeking and paying for solutions outside the plan, or living with a condition that never generates a claim. Treat claims data as a floor on the true scope of GI need in a population, not a ceiling. Mental health prevalence saw the same pattern for years before awareness and benefit design caught up to the reality.
Applied together, these five practices produce a cleaner claims report and surface the true size of the GI opportunity sitting inside a population, most of which the standard approach to claims analysis isn’t built to see.
Seeing the full picture is the first step, not the last one.
Once GI’s true prevalence and cost are visible in your population, the next question becomes urgent: how many of these members have access to a solution built for the full complexity of GI care, not just a narrow slice of it?
Benefits leaders and consultants who start with an accurate claims picture are better equipped to evaluate GI point solutions against what their population actually needs. If you’re working through your own claims data and want a second set of eyes on the GI numbers, we’re glad to help you look closer.